How to Make an Infographic: A Step-by-Step Guide

Our brains process visual content 60,000 times faster than text. Hence, adding visuals to your webpage or blog can quickly grab your audience’s attention and produce up to 94% more views. That’s what an infographic does. It presents information in the form of graphic design so that it can catch the attention and makes it memorable for your target audience.
The use of infographics has skyrocketed in the last ten years. Over 65% of B2B marketers today use infographics as one of their content marketing vehicles.
How to Make an Infographic
- Decide target audience: Know their industry, age group, gender, geographic location) and the medium they are likely to view this.
- Set your goal: The goal helps you decide on the design layout and visual elements.
- Choose your topic: Choose a topic your audience has been searching for; the more specific the subject is, your audience will find it more engaging.
- Collect relevant data: Collect your own data or from credible third-party sources in line with your topic.
- Plan the layout: Create a wireframe of how you want to design the infographic – where to place all elements and what copy to use to create a visual layout.
- Choose a template: Pick one that best represents your content or data set or roughly matches your planned structure or layout.
- Customize the template: Write compelling titles and headings, change the content, visuals, background, font pairings, color scheme, and more.
- Download or publish: You can download it, share it with your team, embed it in your website’s blog post, etc.
In this article, I will tell you how to make an infographic – step-by-step and why an infographic is essential as a content marketing lever. You’ll also see some beautiful professional infographic design templates.
Table of Contents
What Infographic Means
Infographic = Information + Graphic
It’s the visual representation of your information or data so that it is engaging and easy to digest. Whether it’s a step-by-step process that you are explaining or providing some valuable tips, infographics can be an excellent tool to communicate effectively with your target audience.
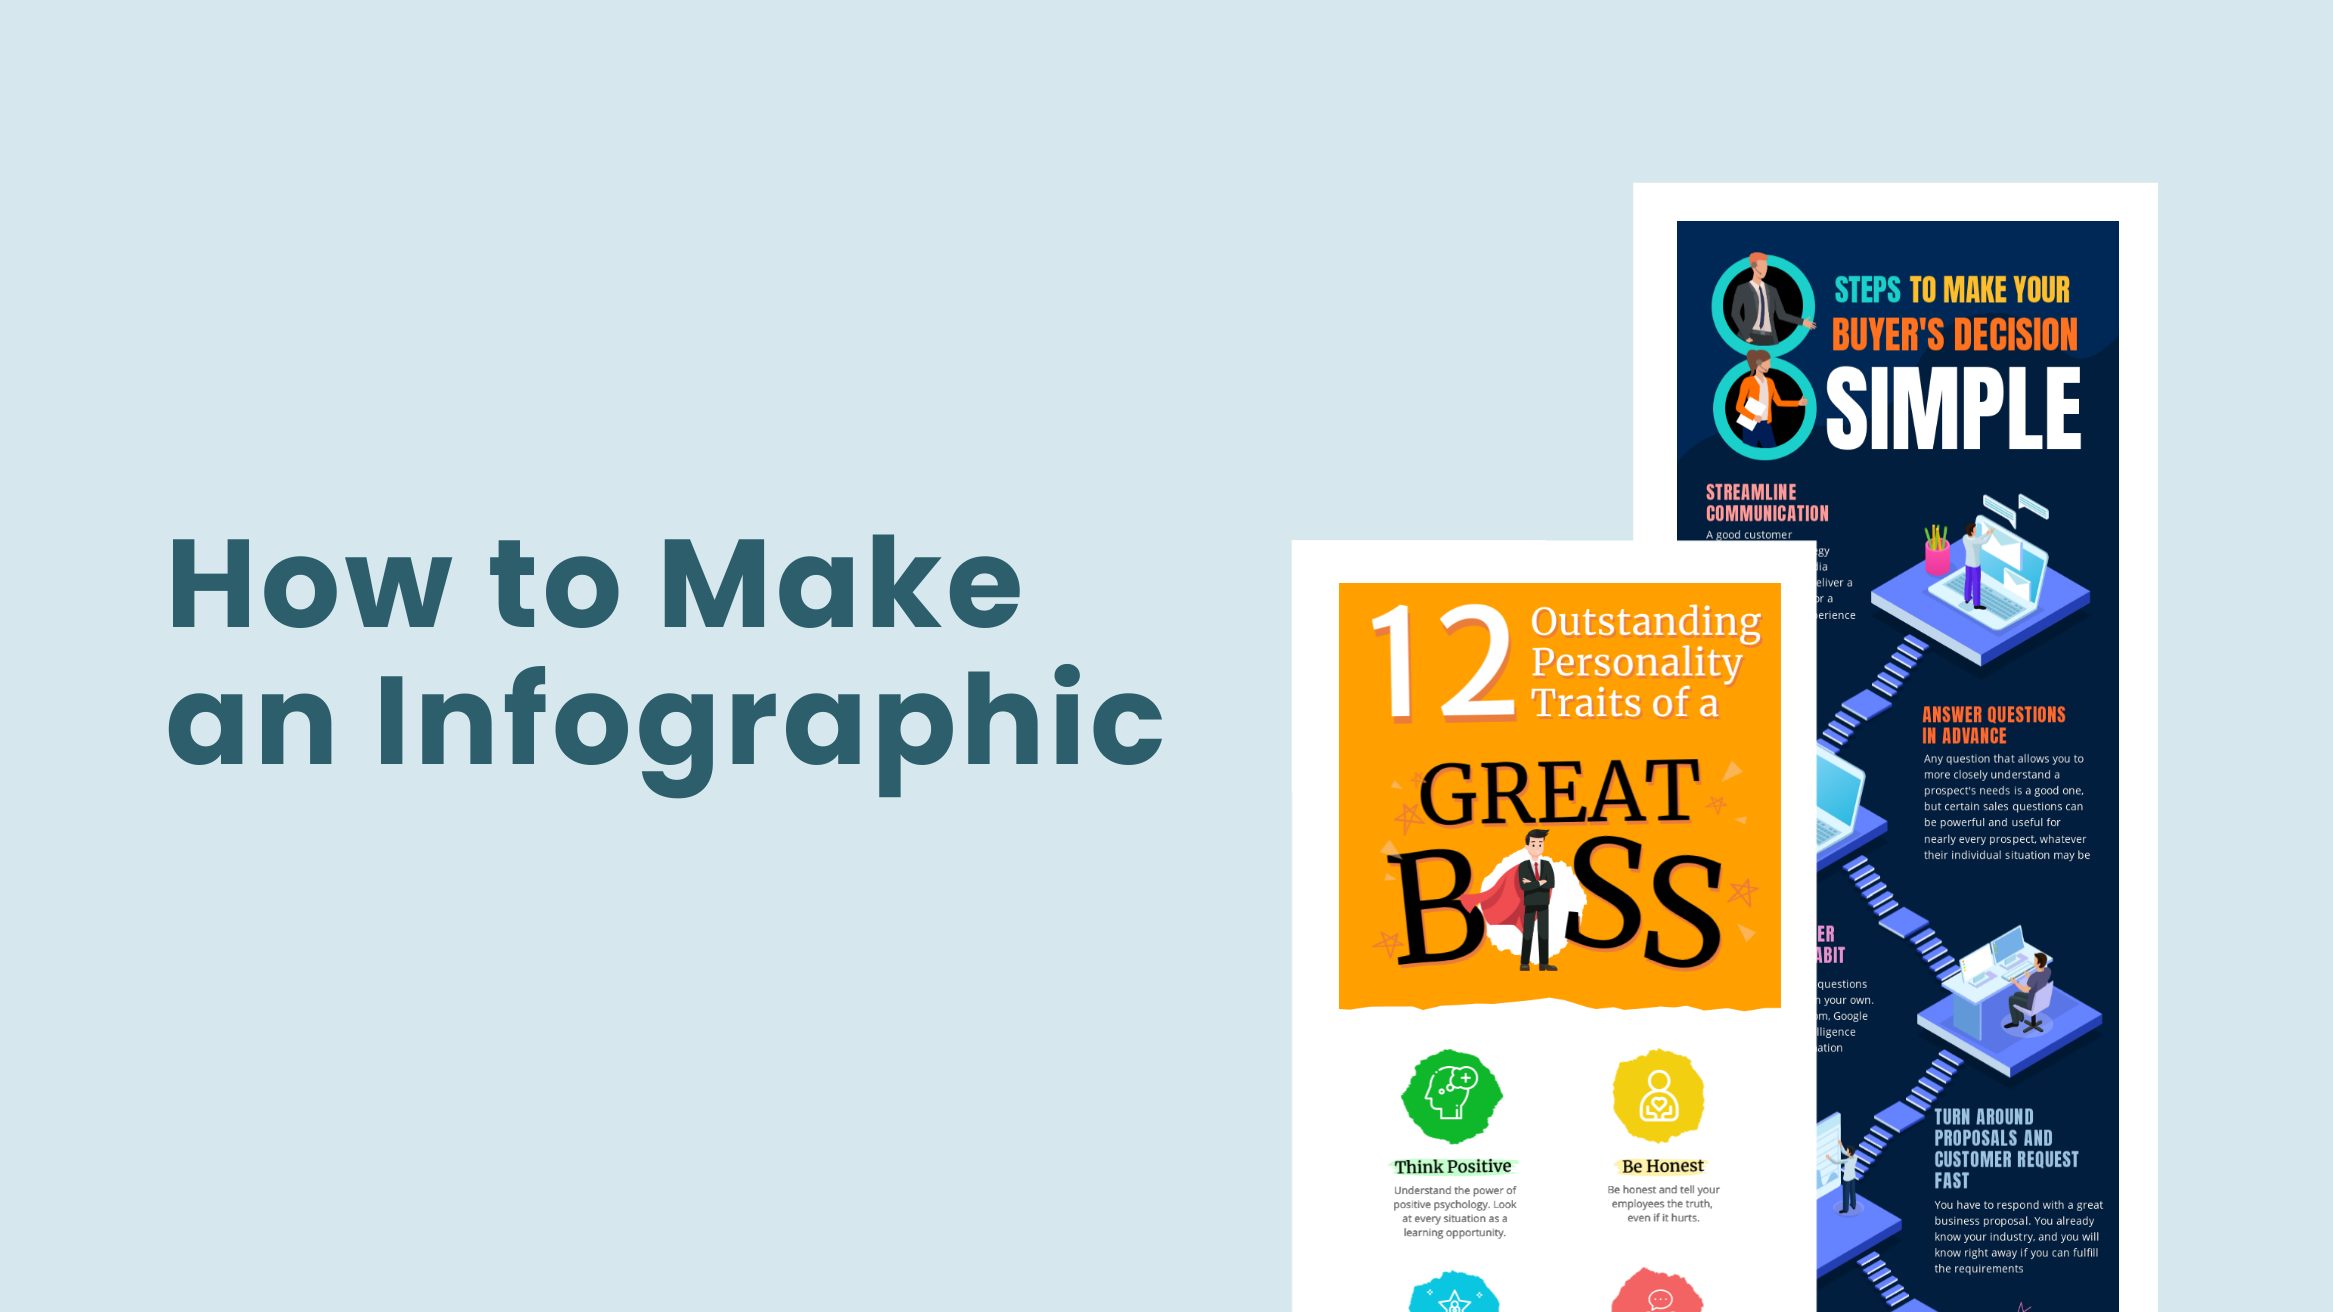
Here’s an example of how different visual elements are combined with text to create a stunning infographic:

Get This Template and More
Why Infographic is Important
Let’s look at the top reasons why infographic is essential as a content marketing lever
1. Attention-Grabbing
It grabs attention quickly and generates more views for your blog or web page.
2. Easy to Understand
Infographic is easy to digest vis-a-vis a wall of text. This shortens your conversion time – from visitor to lead.
3. More Likely to be Shared
Because of the visual nature of the infographic, it’s more likely to be shared on social media. This improves your brand visibility.
4. Memorable
Infographic is more memorable than text content. This makes visitors keep coming back to your site, which in turn helps you climb up in search engine ranking.
How to Create an Infographic Step by Step
If you plan to create a high-impact, engaging infographic – you must prepare before you start designing. Here’s an infographic on how you plan:

Get This Template and More
Step-1: Decide Target Audience
If you design your Infographic targeting everybody, you’re targeting no one. First, decide who you are creating it for (which industry, age group, gender, geographic location) and where they are likely to view this (Pinterest, Instagram, or any other social media). Then it’ll become easy for you to choose the right color, the tone of your infographic copy, and the dimensions.
As you can understand from the DocHipo Infographic template below, the target audience is children.

Get This Template and More
Step-2: Set Your Goal
If you don’t have a clear goal or purpose before creating your Infographic design, the visuals you use might not make sense.
So, what is the goal of your infographic?
The goal could be:
- Explaining a complex process to simplify it
- Presenting interesting facts
- Making a comparison between two options
- Raising awareness by presenting dos and don’ts
- report on any data, etc.
Once identified, the goal helps you decide on the design layout and visual elements.
Step-3: Start with a Topic
Once you decide your target audience and goal, the next step is choosing a topic your audience has been searching for. The more specific the subject is, your audience will find it more engaging.
Step-4: Collect Relevant Data
The core of an infographic is meaningful and easy-to-understand information. Once you find the right topics for your Infographic, collect data in line with your topic. Ensure that the information you gather supports your goal. You can either use your own data or from credible third-party sources. If you use third-party sources, ensure you mention the references in the infographic. Moreover, if you use automation systems to gather this data make sure to leverage Cloudflare bypass tools to avoid any limitations and collect all the insights you might need.
If you are someone who gets stuck in this crucial step, read the simple step-by-step guide on how to conduct research for an Infographic.
Step-5: Plan the Layout
Create a wireframe on a piece of paper on how you want to design the infographic – where to place all elements and what copy to use to create a visual layout before starting the actual design.
Step-6: Check Your Data
In step 4, you have collected the data. However, before using them in the infographic, double-check every piece of data, so there is no error or unreliable third-party sources. Plus, use a strong Smartsheet alternative to organize and validate your data efficiently, ensuring accuracy and reliability in your final presentation.
Step-7: Start Your Design
Now, you’re all set to create a memorable, stunning infographic.
How to Make an Infographic: Quick and Easy
Now that you know how to create an infographic step by step, the next big question is – how to make an infographic – quick and easy!
Do you think that Infographic design is tricky to get right?
An infographic is challenging to design as you must simplify and concisely present complex concepts. You also must balance showing just the needful information and not overwhelming your readers with too much of it.
Even if you choose a brilliant infographic topic and your content flow is on point, your presentation of the content, that is, your design needs to be eye-catching. The design conveys the emotional aspect of your key message, giving an extra dimension to your content. A well-designed infographic should also be fun to read.
It involves a significant learning curve if you’re not from a graphic design background and attempting to create an infographic on your own. You need to know the fundamentals of design principles, master graphic design software, find the right images, icons, and illustrations from the web, and finally, put them all together in a manner that looks appealing. That’s quite a massive ask – right?
Is there a better way? Is there an easy-to-use free infographic maker – where you can access hundreds of free infographic templates designed by some of the best designers in the world and used by hundreds of marketers?
Yes – DocHipo lets you do just that and much more. ?
Let me walk you through how to make an Infographic in 3 simple steps with the help of DocHipo. This will grab the attention of your target audience and save hundreds of your work hours that you can invest elsewhere.
DocHipo: Free Online Infographic Maker
Are you ready?
Here’re the three steps:
Step-1: Choose Your Template
Once you sign up to DocHipo, you’ll see a wide variety of infographic templates under different categories.
Pick the template that best represents your content or data set. You can choose a template that roughly matches the structure or layout you’ve planned and tweak it a little to suit your needs. While you have the option to start from scratch, why put effort when our designers have already done the heavy lifting for you?
Watch the video below to find templates in DocHipo easily.
Our Infographic templates designed by professionals at DocHipo are fully customizable. The pre-built eye-catching templates will help you create high-quality, engaging Infographics.

Watch the YouTube video below for DocHipo’s Infographic design templates that you cannot do without.
Hover over any template that you like. You get options to preview or select to proceed!

Click on “Select.” This will open up a form where
- Your name is captured automatically as the Document Owner (i.e., who owns this document. You can change the ownership to someone else in your team)
- The template name is auto-populated as the Document Name. You can change it.
You can write any description of this Document (infographic) in the Description area.

Click “Next”.
Step-2: Customize Your Chosen Template
Now you land in the editor where you can customize the template.
Change the text, and font type, replace the illustrations and add an image – just like you want using the drag-and-drop editor.
Write Compelling Titles and Headings
Your target audience should be able to figure out what your Infographic is all about the instant they see it. So, craft your titles and headings catchy and descriptive enough that compel them to read the rest of your infographic.
Check out the tips for writing copy that generates results.
Change the Background
You can set the tone and mood for the Infographic with colors as the background. But if you choose inappropriate colors or a combination of colors, your message will convey a different meaning. Your content and context can help you figure out the colors to use. Does your Infographic contain your brand-specific content? If yes, then use your specific brand colors. Otherwise, if it’s about a particular theme, use colors that represent that theme. It’ll also promote your brand consistency.
For example, in the DocHipo Infographic design template below, we’ve used white and shades of blue to convey the effects of global warming.

Get This Template and More
We’ve already written about the best color combinations and how to use them if you need help.
If you want to customize the background in your chosen Infographic design template in DocHipo, select the ‘Background’ widget under the ‘Graphics and Media’ tab on the left sidebar.

As you can see, there are color, gradient, and pattern options to choose from.
Choose the Right Font Pairings
Like colors, fonts also play an important role in perceiving a message or information. Answer the following questions to figure out which types of fonts are most appropriate for your Infographic:
- What’s the mood of your Infographic? Is it fun or serious?
- Who are your target readers? Is it business owners, children, or corporate employees?
Experiment with different font styles (bold, italics, etc.) and sizes. Avoid using too many fonts in your Infographic design.
Choosing a font(s) that catches readers’ attention and is pleasing for them to read is challenging. Finding the perfect font pairings is an art indeed. Check out How To Choose Fonts For Your Design to learn more about this art.

Get This Template and More
Maintain a Balance between the Image and the Text
Make the content of your Infographic scannable and exciting. Turn lines or paragraphs about statistics into any suitable chart for your readers to visualize more easily. Don’t overwhelm your readers. In making your Infographic design attractive, don’t add unnecessary design elements. Otherwise, it will distract your readers and shift their focus from the important information.
Incorporate Engaging Infographic Design Elements
Once you’re done with the content of your infographics, decide on how you’ll present it to make the visualization process much easier.
Yes, I’m talking about the design elements that catch your target audience’s attention and make them read it all the way through.
What graphics to use in your Infographic design depends on the information you’re sharing and the ultimate message you want to convey. Use images, illustrations, icons, or symbols that align with the topic or theme you’re presenting in your infographic.
Look at some of the design widgets that DocHipo equips you with.

We’ve used DocHipo’s built-in illustrations in the Infographic design template below.

Get This Template and More
Here’s a video tutorial on how to use icons in DocHipo.
Step-3: Download or Publish
Once you are ready and delighted with your Infographic design, download it, share it with your team, embed it in your website’s blog post, etc.
Here’s a full-fledged demonstration of how to download documents in DocHipo.
I recommend you watch the video guide below to effortlessly create an engaging Infographic design.
Free Infographic Templates
DocHipo offers a wide variety of pre-designed infographic templates. Based on the goal of your infographic, you can choose the most appropriate one and customize it:
Process Infographic
A process infographic template is used when you intend to present the steps involved in accomplishing something. Here’s one such template in DocHipo:

Get This Template and More
Tips Infographic
This infographics category is useful when you share tips or best practices with your target audience. Here’s one such template in DocHipo:

Get This Template and More
How-To Infographic
This infographics category is applicable when you share a step-by-step process to do a specific task.

Get This Template and More
Dos and Don’ts Infographic
This category of infographics is useful for spreading awareness. Here’s one such template in DocHipo:

Get This Template and More
There are more such gorgeous infographic templates inside DocHipo.
Wrapping Up
Infographics are effective content tools for sharing complex or chunky information. You must include them in your content marketing strategy to engage your audience. I hope you got ideas and inspiration from the DocHipo templates I shared as examples. Since you know the steps of making a good Infographic design, you’ll create attractive and engaging Infographic designs in no time. So, sign up to DocHipo for free, explore the Infographic design templates, leverage the design elements needed, and make the most of it.
FAQs
What are the key components of an effective infographic design?
The key components of an effective infographic design include its apparent purpose, crucial information in digestible chunks, relevant and engaging visuals, key facts and figures from reputable sources, and overall neat and visually appealing design.
How to determine the appropriate layout and format for an infographic?
Before designing your infographic, clarify the main point you want to convey, your target audience, and your end goal. Now, think about the type and amount of information you need to present to determine the appropriate infographic format. For example, choosing a process infographic or flowchart format would work best if you want to illustrate a process in the easiest way possible.
Next, choose an infographic layout that allows you to present complex information or tell a story in the most appealing and visually engaging way. The layout should help you achieve a clear hierarchy, visual balance, proper alignment, and ample whitespace.
What mistakes to avoid when designing an infographic?
Some mistakes to avoid when designing an infographic include writing big chunks of text,
poor design that doesn’t appeal to the target audience, making the design unnecessarily complicated or cluttered with too many fonts, colors, or visual elements, adding inaccurate charts, and so on.
What are some ways to measure the effectiveness of an infographic in achieving its goals?
Depending on your objectives and where and how you use your infographics, you can choose suitable tools to measure their effectiveness. If the infographic is published on your website or in blog content, use Google Analytics to track the traffic, conversion rates, bounce rate, etc. If you share the infographic on social media, use their analytics features, such as Facebook Insights, LinkedIn Analytics, or Twitter Analytics, to track the reach, views, clicks, engagement (likes, comments, shares), etc. If your goal is to make your target audience take your intended action, track the number of downloads, sign-ups, purchases, etc.